I finally added proper monitoring to the homelab.
The monitoring VM now runs Prometheus, Grafana, and Node Exporter. Everything is reachable only through ZeroTier, SSH is key-only, root login is disabled, and UFW only allows SSH and Grafana through the ZeroTier interface.
Prometheus currently monitors two machines:
- the monitoring VM itself;
- the files VM.
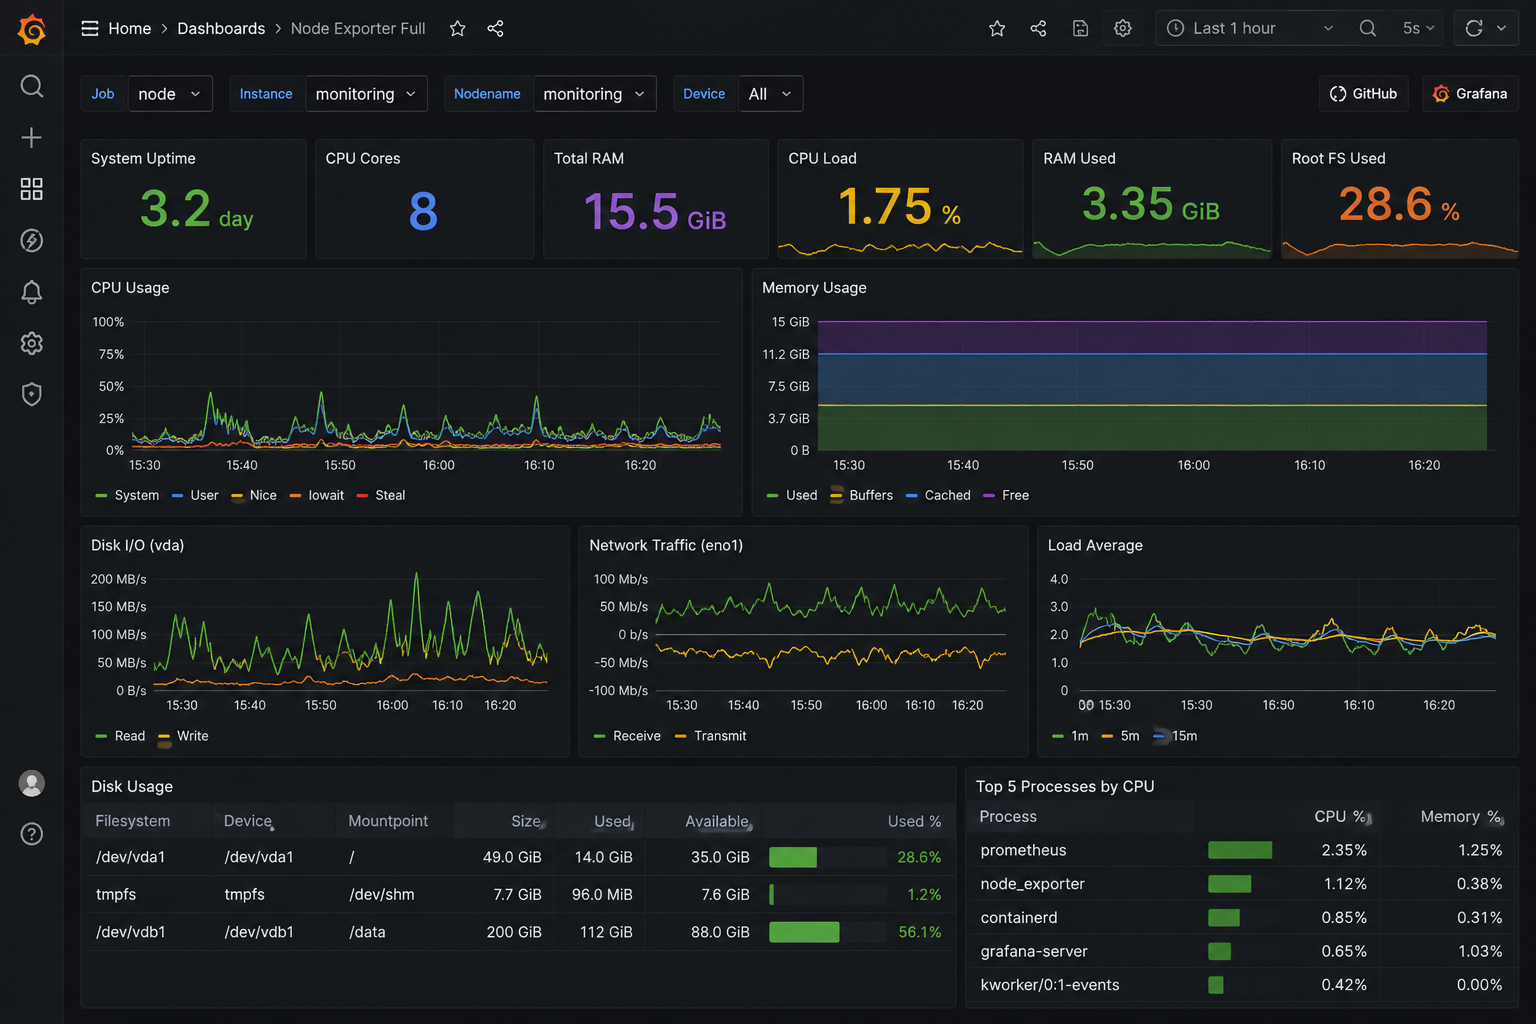
Grafana is using a Node Exporter dashboard, so I can switch between the machines and see CPU, memory, disk, network, uptime, and the usual wall of graphs.
It is slightly more colourful than necessary, but it works.
The remaining machines will be added later. For now, the basic monitoring system is finished and can quietly collect data in the background.
(Can you guess who wrote this? I will go on playing Warcraft later myself btw, so stay tuned!)